Key takeaways
- A 60/40 portfolio means 60% stocks and 40% bonds, a moderate-risk mix rooted in Harry Markowitz's Nobel Prize-winning research on diversification.
- In 2022, stocks and bonds fell together for the first time in years, and a 60/40 portfolio lost about 20% from the start of the year through late September, a decline exceeded only twice before, both during the Great Depression.
- Most professionally managed retirement money, including target-date funds holding roughly $4.9 trillion in assets, doesn't hold a fixed 60/40 but instead shifts the mix based on time horizon, heavier on stocks early and more conservative closer to retirement.
Whether 60/40 fits you depends less on the calendar year and more on your own time horizon, other income sources, and how you really handled the last real downturn.You've probably heard the phrase "60/40 portfolio" tossed around by a financial advisor, a 401(k) plan document, or a headline about the market. Maybe you've looked at your own retirement account and wondered whether the mix you're holding still makes sense at this stage of your life, especially after a few years where stocks and bonds didn't behave the way you expected them to. If you're within a decade or two of retirement, that question isn't academic. It's whether the strategy sitting under your savings is doing the job you need it to do.
Here's what the 60/40 is, where it came from, what happened to it in recent years, and how to think about whether it fits your situation today.
What does "60/40" mean?
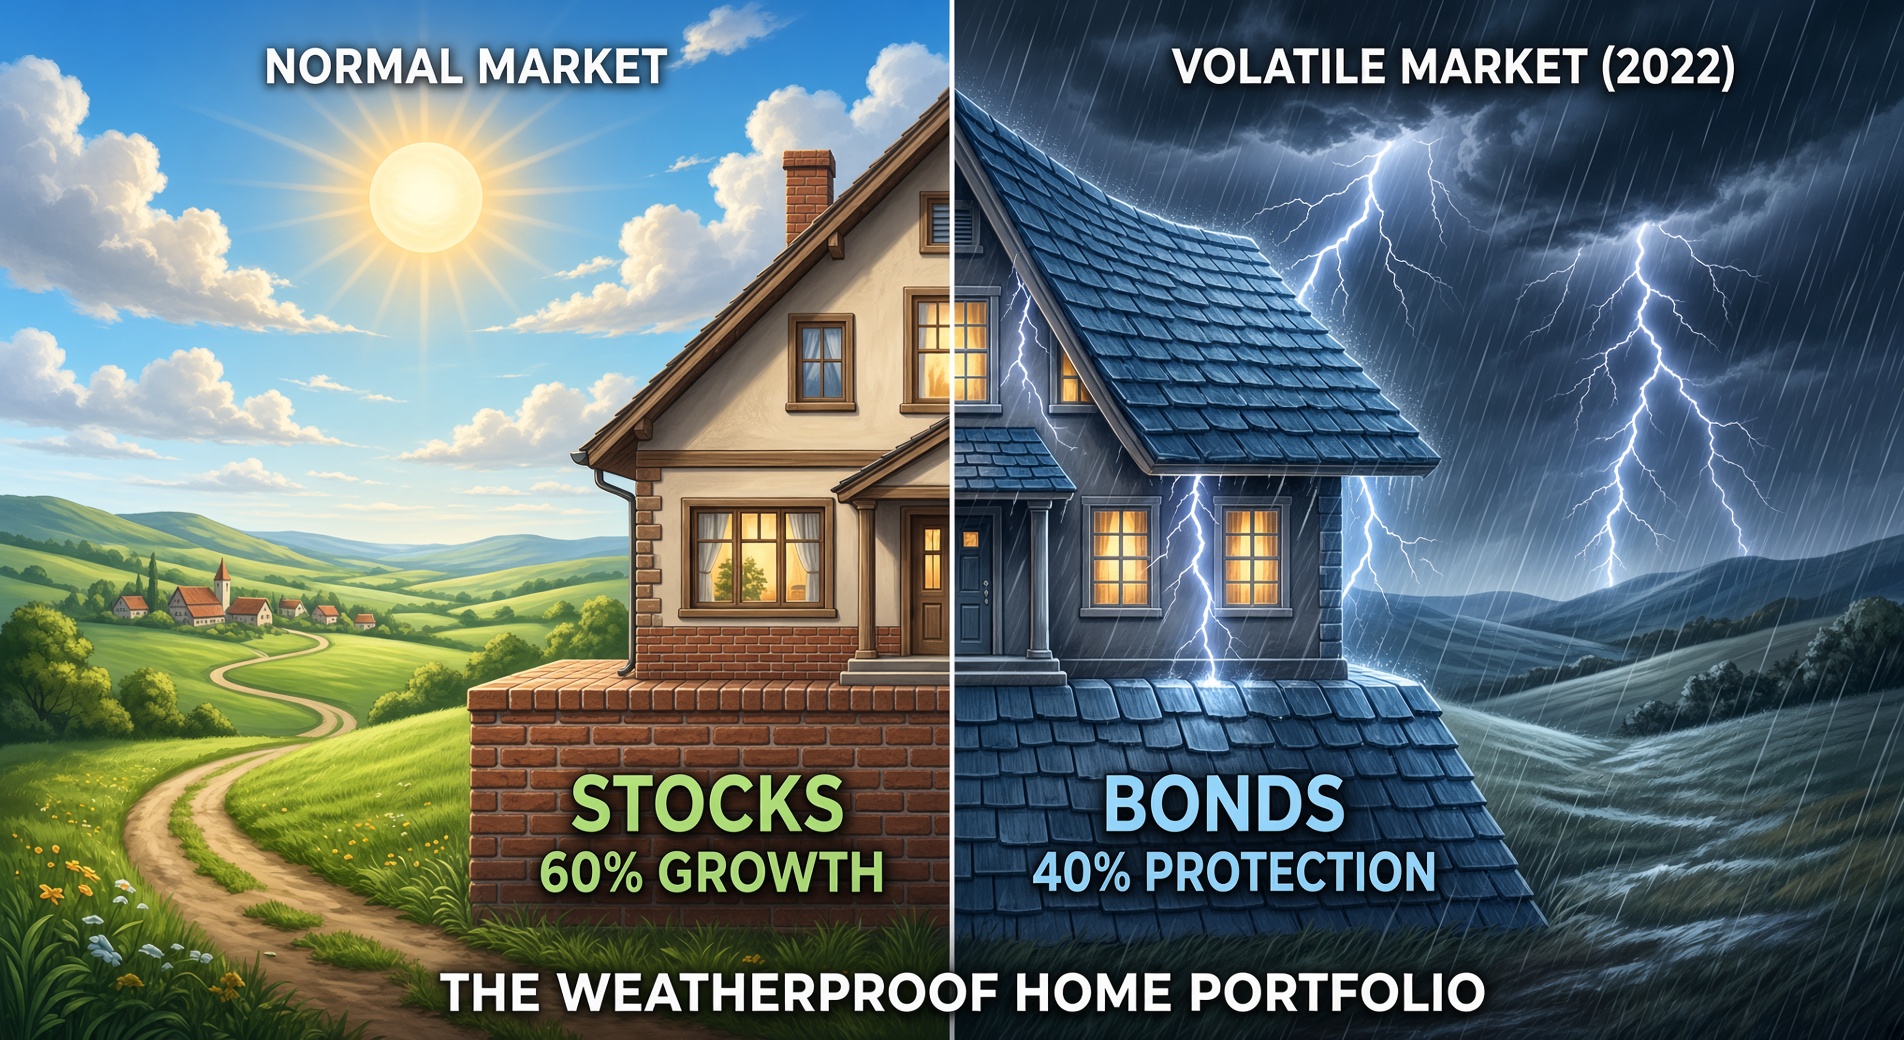
A 60/40 portfolio puts 60% of your money in stocks and 40% in bonds. Stocks are there for growth, bonds are there to smooth things out, since they tend to hold up better when stocks fall.
The specific 60/40 split represents a moderate-risk portfolio. One that isn't as aggressive as an all-stock portfolio and isn't as conservative as one loaded up on bonds and cash. Plenty of people hold something close to 60/40 without ever calling it that. A target-date fund, a balanced mutual fund, or a mix you assembled yourself in a 401(k) all follow the same basic logic even if the exact numbers are 65/35 or 55/45.
The two pieces play different roles, and understanding that division is the whole point of the strategy. Stocks represent ownership in companies, so their value rises and falls with corporate profits, investor sentiment, and the broader economy, which is why they can swing sharply in either direction over short periods. Bonds are essentially loans to governments or corporations that pay a fixed rate of interest over a set term. That fixed structure makes their returns steadier and more predictable, but it also caps how much they can grow.
Where did this ratio come from?
The idea traces back to work done by economist Harry Markowitz in the 1950s, research that eventually won him a Nobel Prize. Markowitz showed something that sounds obvious in hindsight, which is combining assets that don't move in perfect lockstep with each other can lower a portfolio's overall risk without necessarily lowering its expected return.
That insight became the foundation of what's now called modern portfolio theory.
Stocks and bonds turned out to be a convenient real-world pairing for that idea. Stocks have historically delivered higher returns over long periods, but with sharp swings in the short term along the way. Bonds have offered lower but steadier returns, and for much of the past several decades, they've tended to hold their value or even gain when stocks dropped, since central banks typically cut interest rates during economic slowdowns, which pushes bond prices up right as stocks are falling. That relationship, bonds acting as a cushion when stocks fall, is the entire reason 60/40 became the default answer to "how should I invest" for a moderate-risk investor.
The specific 60/40 split itself wasn't handed down by Markowitz's original math. His research showed how to construct an optimal mix given a set of assumptions about risk and return, not a single fixed ratio that applies to everyone. Over the following decades, as pension funds, endowments, and financial advisors put the theory into practice, 60/40 emerged as a convenient, easy-to-communicate reference point for a moderate-risk portfolio. It stuck for the same reason a lot of financial rules of thumb stick.
It's simple to explain, simple to implement, and it worked reasonably well for a long stretch of market history.
Over time, 60/40 became less a specific recommendation and more an industry-wide reference point, the mix that target-date funds, robo-advisors, and financial planners use as their starting assumption before adjusting for someone's particular situation.
Why does the ratio matter to me?
Because the ratio determines how much of your portfolio's swings you're going to feel, and how much growth you're giving up to avoid feeling them. A portfolio that's 90% stocks will grow faster on average over a long enough period, but it will also drop harder in a bad year, the kind of drop that's a lot easier to sit through at 35 than at 63. A portfolio that's 30% stocks will barely register a bad stock market year, but it also won't grow enough to keep pace with what you'll likely need decades into retirement.
60/40 sits in the middle of that spectrum on purpose. It's not the right mix for everyone, but it's a reasonable default for someone who wants real growth potential without betting everything on the stock market, which is exactly why so many retirement accounts default to something close to it.
Here’s an example. A decline of 30% or more in a single year isn't unusual for an all-stock portfolio during a genuine downturn. This could mean a $500,000 portfolio that's 90% stocks might drop to roughly $350,000 or lower in a severe bear market. A 60/40 version of that same $500,000, by contrast, has historically lost far less in those same stretches, since the bond portion isn't falling at the same rate, or in some environments isn't falling at all. That difference in how deep the drop goes, not just the average return over decades, is the actual tradeoff you're making when you pick a ratio.
What happened to 60/40 in 2022?
For most of the previous forty years, the 60/40 formula worked close to as advertised. Then 2022 arrived, and the relationship it depends on broke down. The Federal Reserve raised interest rates at one of the fastest paces in decades to fight inflation, and rising rates hurt bond prices directly, since existing bonds paying lower rates become less attractive the moment new bonds offer higher ones. At the same time, rising rates also pressured stock prices, since higher rates make future company earnings worth less in today's dollars. For the first time in years, stocks and bonds fell together instead of one cushioning the other.
A 60/40 portfolio invested in benchmark U.S. stock and bond indexes lost about 20% from the start of 2022 through late September of that year, a decline exceeded only twice before, both times during the Great Depression(1). It wasn't a small blip. Commentators at the time openly asked whether the 60/40 portfolio, a strategy that had defined moderate investing for decades, was finished. Some financial firms went as far as publishing pieces with titles declaring the strategy dead outright.
Does that mean 60/40 is dead?
Not necessarily. Even the analysts flagging the historic scale of the 2022 decline were careful to separate a bad year from a broken strategy. Charles Rotblut, vice president of the American Association of Individual Investors, put it plainly at the time: asset allocations are designed to be followed over many years, and abandoning one because of a single rough stretch defeats the purpose of having a target allocation in the first place(1). The 60/40 model remains common precisely for people within five to ten years of retirement or already drawing on their accounts, according to Rotblut, which is the group most likely to feel 2022 the hardest and the group the strategy was built to serve.
What 2022 showed is that the relationship 60/40 depends on, stocks and bonds rarely falling together, isn't a permanent law. It's a pattern that holds most of the time and occasionally doesn't, which is a case for periodically checking your allocation, not for concluding the strategy stopped working.
Is 60/40 still the right mix for someone my age?
This is really the question underneath all of it, and the honest answer is that it depends less on the calendar year and more on where you are in your own timeline. The entire reason 60/40 works as a starting point rather than a universal answer is that risk tolerance and time horizon change as you get older. Someone in their 30s has decades to recover from a bad stretch in the stock market. Someone five years from retirement doesn't have that same runway, which is exactly why most professionally managed retirement money doesn't sit at a fixed 60/40 forever.
Target-date funds, the default option in most 401(k) plans, are designed around this exact idea.
T. Rowe Price's retirement-focused glide path, for example, holds a 98% stock allocation for investors more than 30 years from retirement, and gradually shifts that down to 55% stocks right at the retirement date, continuing to ease further to 30% stocks over the following 30 years(2). The logic isn't unique to T. Rowe Price. Every major fund company runs some version of the same idea, heavy on stocks early, gradually more conservative as retirement approaches, because the cost of a bad year changes depending on how many years you have left to recover from it. A 30% drop at age 35 is an inconvenience that time will erase. The same drop at age 64, right before you plan to start drawing income, is a very different problem.
This is also why target-date funds have become the default choice for so much retirement money. Roughly $4.9 trillion was invested in target-date funds as of the end of 2025(3), which tells you that a large share of American retirement savers are effectively riding some version of an age-adjusted 60/40, whether or not they've ever thought about it in those terms.
So how do I know if my portfolio mix still fits?
A few questions are more useful here than trying to find one universal number.
How many years until you'll need the money? If retirement is 20-plus years away, a heavier stock allocation, closer to 80/20 or 90/10, has historically made sense, since you have time to ride out a downturn. If you're within five years of needing to draw on the money, a more conservative mix, with a larger bond allocation than the classic 60/40, is usually the more comfortable fit.
How did you really feel during 2022, or during any other sharp downturn? Not how you think you should have felt. If watching your balance drop made you seriously consider selling out of stocks, that's useful information about your real risk tolerance, separate from what a textbook allocation might recommend.
Do you have other sources of income in retirement? Someone with a pension or a larger Social Security benefit covering essential expenses can often afford to keep more in stocks than someone relying entirely on portfolio withdrawals, since a guaranteed income floor changes how much risk the invested portion needs to absorb.
Are you rebalancing, or letting the mix drift? A portfolio that started at 60/40 five years ago and hasn't been touched since is very likely no longer 60/40 today, since strong stock years push the stock percentage higher than the original target without anyone doing anything. Checking your allocation against your intended target, at least once a year, is what keeps a 60/40 strategy behaving like one. Rebalancing itself is straightforward in practice. If stocks have grown to 68% of the portfolio and bonds have shrunk to 32%, you sell enough stock and buy enough bonds to bring the mix back to 60/40, locking in some of the stock gains and restoring the balance the strategy depends on. Many workplace retirement accounts and target-date funds do this automatically, but a portfolio you manage yourself needs a periodic check to make sure the numbers still match the intention.
What about alternatives to the classic split?
The 2022 experience pushed some institutional investors to add a third piece alongside stocks and bonds, things like real estate, commodities, or infrastructure, on the idea that these assets sometimes move differently from both stocks and bonds at once, offering a cushion when the traditional 60/40 relationship temporarily breaks down. That's a reasonable approach for someone who wants to hedge against another year like 2022, though it also adds complexity and cost that a simple two-asset portfolio doesn't have.
For most people, the more practical lesson from 2022 isn't to abandon stocks and bonds for something more exotic. It's a reminder that even a well-constructed portfolio can have a bad year, and that the right response to a bad year is usually to check whether your allocation still matches your timeline and risk tolerance, not to abandon the strategy altogether based on twelve months of performance.
Common mistakes worth avoiding
Assuming 60/40 is a fixed rule rather than a starting point. The number exists as shorthand for "moderate risk," not as a mandate. Your actual mix should reflect your own time horizon and comfort with volatility, which may look nothing like 60/40.
Reacting to a single bad year by abandoning the strategy. 2022 was genuinely unusual, but the years that followed showed why sticking with a diversified approach through a rough stretch has historically paid off more than jumping to something new right after a loss.
Letting the portfolio drift without rebalancing. Years of strong stock performance can gradually push a 60/40 portfolio to 70/30 or higher, increasing your risk exposure without any deliberate decision on your part.
Treating age as the only factor. Time horizon plays a real role, but so does your other income in retirement, your actual tolerance for watching your balance fall, and how much flexibility you have if the market has a rough few years right when you need to start withdrawing.
If you're not sure whether your current mix still matches your timeline and risk tolerance, a financial advisor can walk through your specific situation, including your other income sources and how close you are to needing the money, and help you figure out whether your allocation still makes sense or needs adjusting.
Answer a few questions below to get matched with an advisor:
References
1. CNBC. "This classic investment strategy is on track for its 'worst year ever'—here's what to do with your money." October 3, 2022. https://www.cnbc.com/2022/10/03/why-60/40-portfolio-is-on-track-for-its-worst-year-ever-says-cio.html
2. T. Rowe Price. "Target Date Solutions." https://www.troweprice.com/financial-intermediary/us/en/capabilities/target-date-solutions.html
3. Investment Company Institute. "Target Retirement Date Funds." https://www.ici.org/resource-hubs/target-retirement-date-funds
Historical returns and glide path figures reflect data as of the dates cited above and will change over time. Past performance is not a guarantee of future results. Asset allocation and diversification do not ensure a profit or protect against loss.