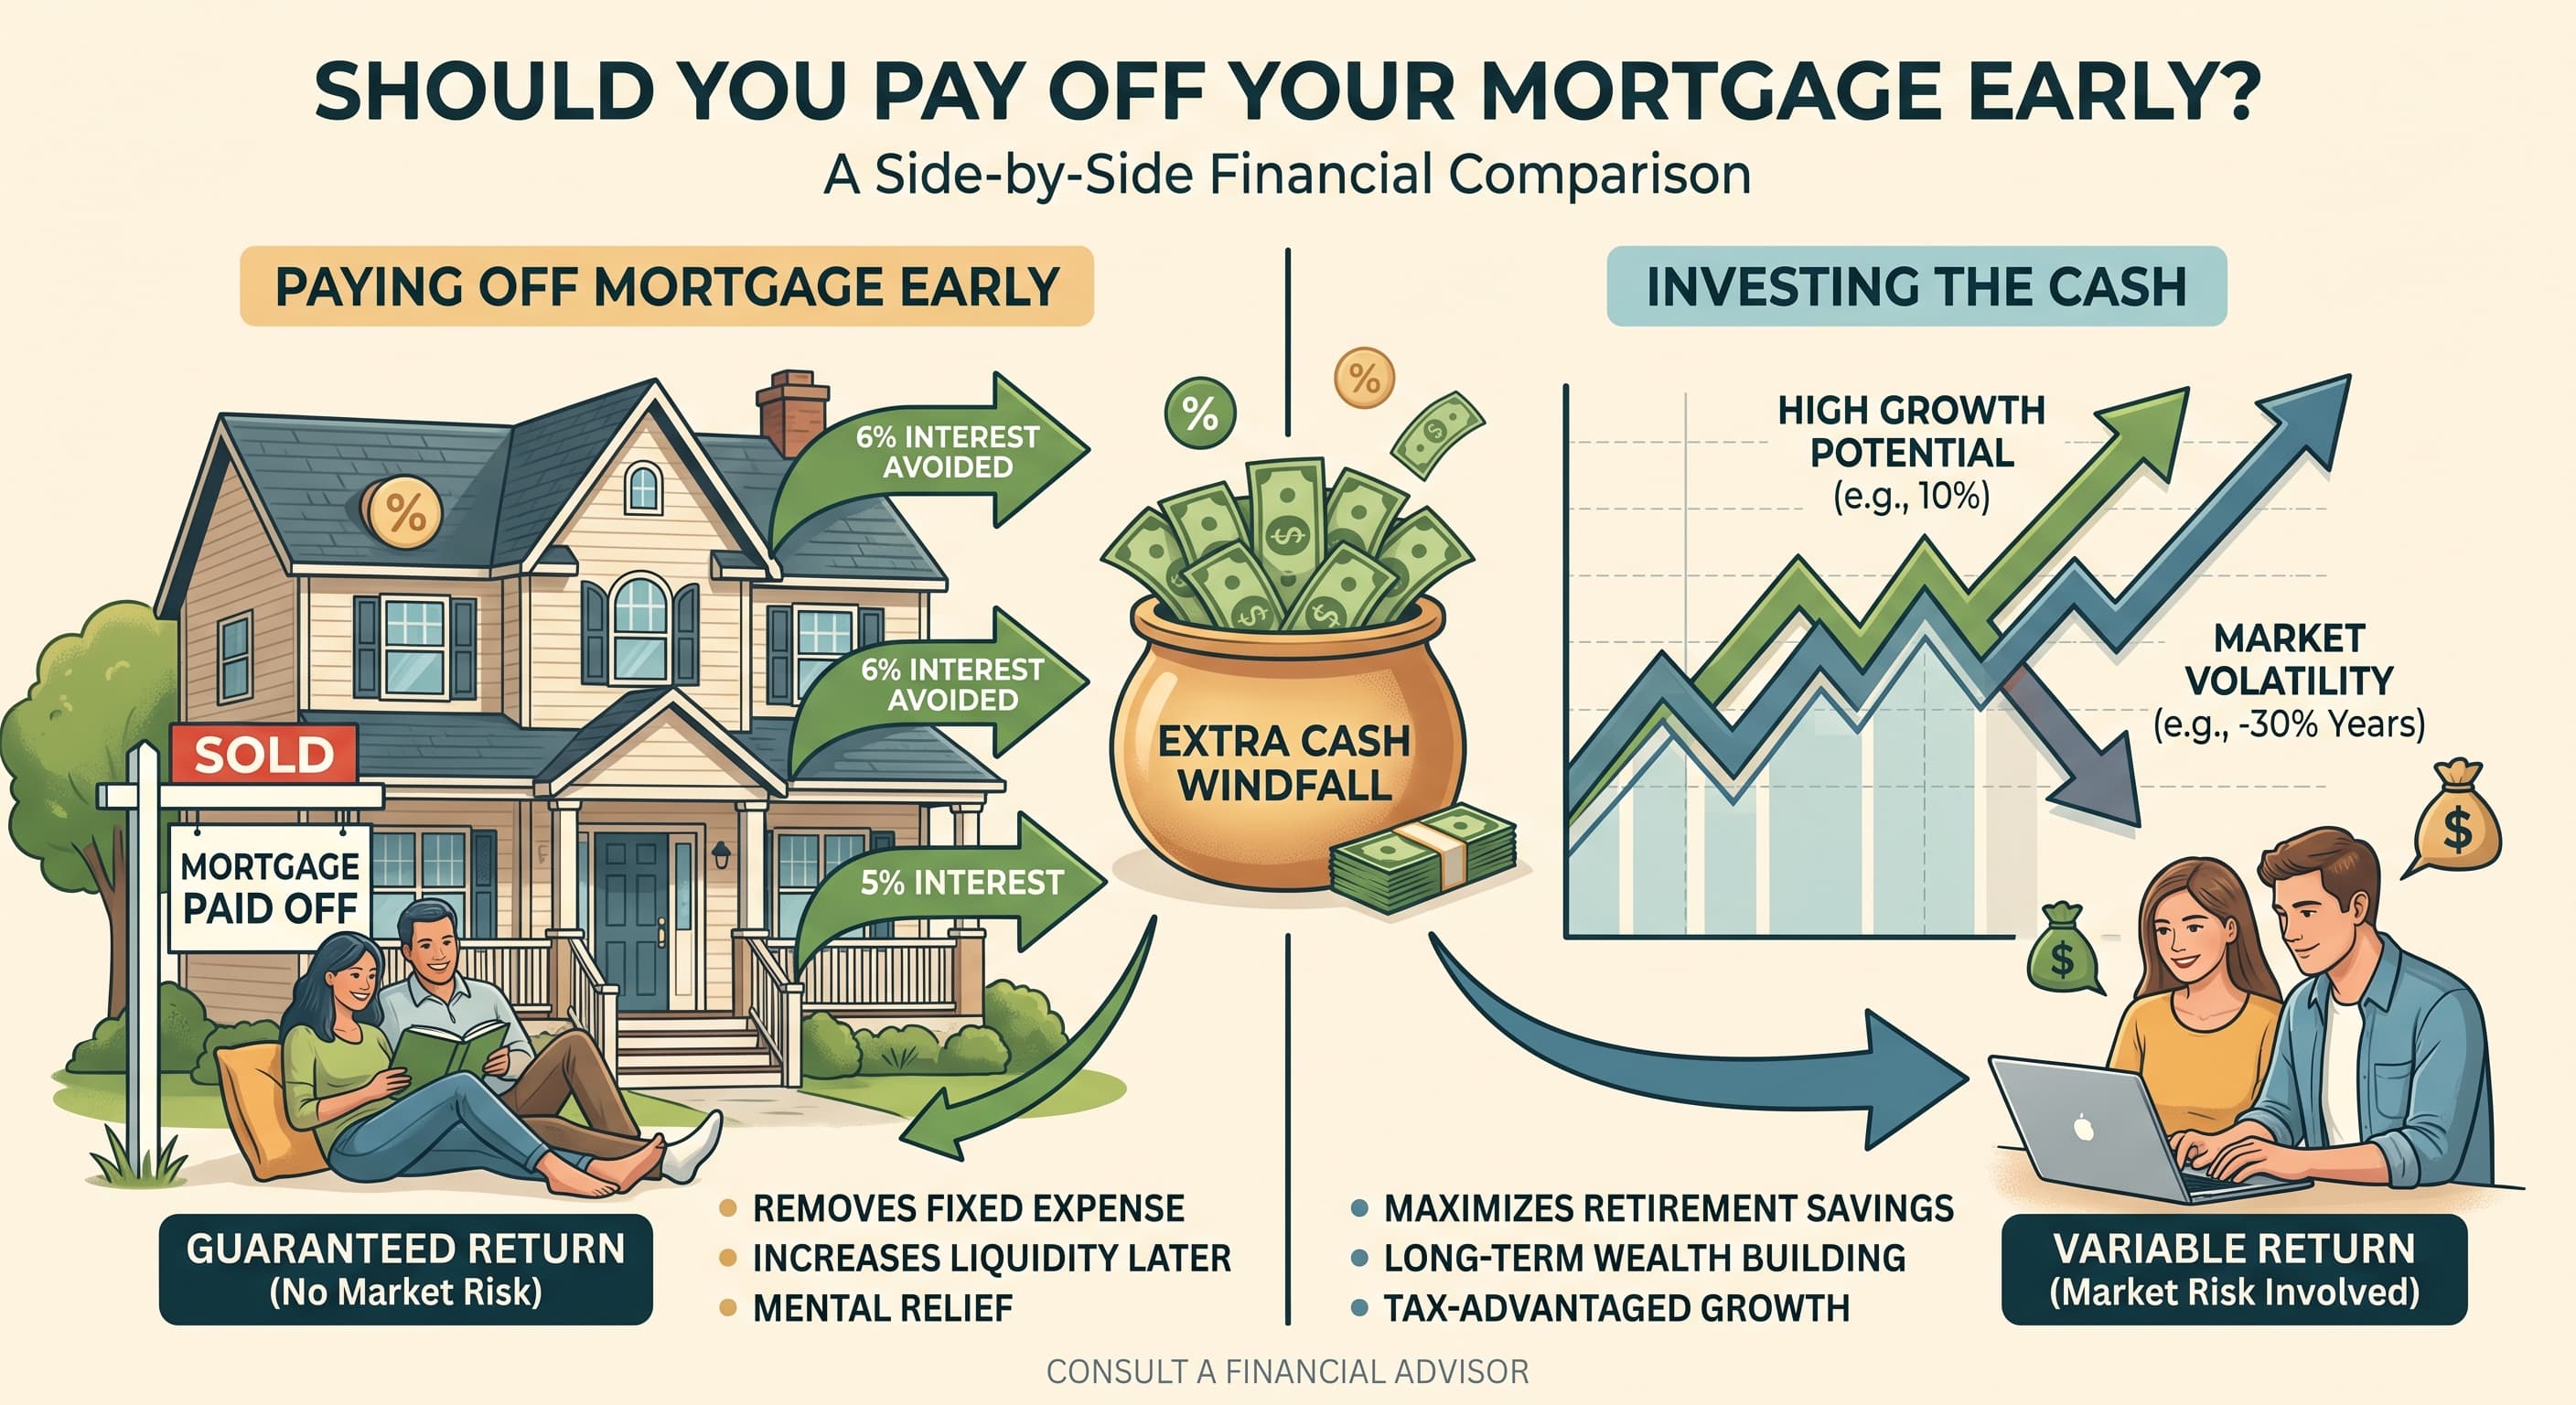

To some people, $1 million in your portfolio sounds like a finish line. In practice, it's a starting number that has to be turned into a paycheck that helps you thrive in your retirement years, and the size of that paycheck depends on choices you make about withdrawal rate, asset mix, and how you sequence your income sources. Under the widely used 4% guideline, $1 million produces about $40,000 in the first year of retirement(1).
Under Charles Schwab's updated 2026 modeling, that range runs from roughly $37,000 to $48,000 depending on your time horizon and confidence level(1).
That's a significant spread in not only money, but potentially lifestyle too. The difference between $37,000 and $48,000 a year can be the difference between a tight budget and genuine flexibility. This article walks through where these numbers come from, how Social Security and required withdrawals change the math, what a portfolio in cash, dividends, or an annuity might pay, and the mistakes that shrink a $1 million balance faster than it should.
Why $1 million doesn't have one answer
The instinct is to want a single, clean number is natural. That’s because it’s easier to estimate your money if the numbers are clean and simple. $1 million pays $X a year, done. But retirement income planning doesn't work that way, because the "right" withdrawal rate depends on how long the money needs to last, how it's invested, and how much risk of running short you're willing to accept.
Schwab's Center for Financial Research models this directly. For a 30-year retirement with a moderate asset allocation, the firm's 2026 analysis puts a sustainable initial withdrawal rate between 4.2% and 4.8%, or $42,000 to $48,000 in year one on a $1 million portfolio(1). Shorten the time horizon to 20 years with a more conservative mix, and the sustainable rate rises to 5.8% to 6.3%, or $58,000 to $63,000(1).
A 65-year-old retiring today has an average remaining life expectancy under 30 years, according to Social Security Administration data, which is part of why the numbers shift as retirement gets closer(1)(9).
The other variable is confidence level, meaning how certain you want to be that the money outlasts you. Schwab defines this as the percentage of 1,000 simulated market scenarios in which the portfolio still had money left at the end of the period(1). A 90% confidence level produces a lower, more conservative withdrawal amount. A 75% confidence level allows more spending now, with a higher chance you'd need to adjust later if markets underperform(1). Neither number is wrong. They're two different bets on how much certainty is worth to you.
The 4% rule, and why it's a starting point, not a formula
The 4% rule is the reference point most people have heard of, and it still has a place. Multiply your portfolio by 4% and that's your first-year withdrawal, adjusted for inflation every year after. On $1 million, that's $40,000 in year one(1).
But the rule was built on a specific set of assumptions that don't automatically apply to you.
It assumes a 50/50 stock-and-bond portfolio, a 30-year retirement, and that you increase spending by inflation every single year regardless of how your investments perform(1). It also doesn't account for taxes or investment fees, which come out of the withdrawal amount rather than on top of it(1).
Schwab's research also found that retirees, on average, don't actually spend a constant inflation-adjusted amount throughout retirement. Spending tends to decline over time, which the rigid version of the 4% rule doesn't capture(1). That's a substantial difference between the textbook model and how people really live.
What this means in practice is you should treat 4% as a sanity check, not a concrete plan.
If you're regularly withdrawing more than what your time horizon and confidence level suggest, that's a signal to revisit your spending. If you're withdrawing less, you may be leaving comfort on the table that you've already earned.
Where the paycheck actually comes from
A $1 million portfolio doesn't have to fund your entire retirement income by itself, and for most people, it shouldn't.
Here's how the pieces typically fit together:
- Social Security. The estimated average monthly Social Security retirement benefit for January 2026 is $2,071, or about $24,850 a year, and benefits rose 2.8% for 2026 under the annual cost-of-living adjustment(2,3). For a couple both drawing benefits, that can mean roughly $45,000 to $50,000 a year before the portfolio is touched at all. Combine an average Social Security benefit with a $40,000 portfolio withdrawal, and a single retiree is already looking at around $65,000 in annual income, with a couple potentially well above $85,000.
- Portfolio withdrawals. This is the $37,000 to $48,000 range covered above, depending on time horizon, allocation, and confidence level(1).
- Dividends, if the portfolio is stock-heavy. A $1 million portfolio invested in large-cap U.S. stocks would have generated dividend income at roughly a 1.16% to 1.4% yield as of the fourth quarter of 2025, according to S&P Dow Jones Indices, translating to somewhere around $12,000 to $14,000 a year in dividends alone before any principal is sold(7). That's below the long-term historical average yield, which is part of why relying on dividends alone to fund retirement has gotten harder in recent years.
- An income annuity, for part of the balance. If you converted a portion of the portfolio into a single premium immediate annuity, Schwab's own income annuity estimator showed a 65-year-old man could expect roughly $625 to $665 a month in lifetime income per $100,000 annuitized as of mid-2026 market rates, with a 65-year-old woman receiving somewhat less due to longer average life expectancy(8). On $1 million fully annuitized, that's a rough (and almost certainly undesirable, for reasons covered below) $75,000 to $80,000 a year, guaranteed for life but with little to no liquidity or growth potential left over.
Most retirees blend these sources rather than picking just one. The portfolio funds the flexible portion of spending, Social Security provides a guaranteed floor, and some retirees layer in a partial annuity or dividend tilt depending on their comfort with market risk.
A quick comparison
Income source | Rough annual payout on $1M (or relevant share) | Guaranteed? | Keeps growth potential? |
|---|---|---|---|
4% portfolio withdrawal | $40,000(1) | No | Yes |
Schwab 30-year moderate range | $42,000–$48,000(1) | No | Yes |
S&P 500 dividend yield only | ~$12,000–$14,000(7) | No | Yes |
Full annuitization at 65 (male) | ~$75,000–$80,000(8) | Yes, for life | No |
Average Social Security benefit | ~$24,850/year, per person(2) | Yes, with COLA(3) | No |
The point of this table isn't that one row is "correct." It's that each option trades something for something else, for example, flexibility for certainty, growth potential for guaranteed income, or simplicity for control.
What this looks like for a single retiree versus a couple
All of the numbers change depending on whether you're planning for one person or two, and it's worth walking through both because the difference is bigger than many people expect.
A single retiree with $1 million, using Schwab's 30-year moderate-allocation range, could reasonably plan on $42,000 to $48,000 in year-one portfolio withdrawals(1). Add the average Social Security benefit of roughly $24,850 a year, and total income lands somewhere between $67,000 and $73,000 before taxes(1,2). That's a workable number in most parts of the country, though it leaves less room for surprises than it might first appear, especially once healthcare costs are factored in separately.
For a couple, the picture depends heavily on whether both partners have their own $1 million, or whether they're splitting one $1 million balance between two people and two Social Security checks. If it's the latter, the portfolio numbers don't change (the withdrawal range is still $42,000 to $48,000), but it now has to stretch across two people's living expenses(1). What does change is the Social Security side. Two average benefits together add up to roughly $49,700 a year, which raises the household floor even though the portfolio itself hasn't grown(2).
Combined, that's $92,000 to $98,000 in projected annual income for a couple relying on a single $1 million portfolio plus two Social Security benefits.
This is also where the timing of when each spouse claims Social Security becomes a real lever. Claiming before full retirement age permanently reduces the monthly benefit, while delaying past full retirement age increases it, up to age 70. Because Social Security is one of the few genuinely guaranteed, inflation-adjusted income sources most retirees have, decisions about claiming age are worth treating with as much care as the portfolio withdrawal rate itself, particularly for the higher earner in a couple, since that benefit can become a survivor benefit later.
How taxes eat into what you actually get to spend
Every withdrawal rate discussed so far, including Schwab's 4.2% to 4.8% range, is calculated before taxes and fees(1). What actually lands in your checking account is smaller than the headline withdrawal figure, and how much smaller depends heavily on which accounts the money comes from.
Withdrawals from a traditional IRA or 401(k) are generally taxed as ordinary income in the year you take them. Withdrawals from a Roth IRA, assuming the account meets the holding-period and age requirements, are generally not. A portfolio split across both account types gives you more control over your taxable income each year, because you can choose which bucket to draw from based on what your tax bracket looks like that year. A portfolio concentrated entirely in tax-deferred accounts doesn't offer that flexibility, and required minimum distributions eventually remove the choice altogether.
This is one of the more overlooked pieces of the "$1 million pays you X" question. Two retirees with identical $1 million balances and identical withdrawal rates can end up with very different after-tax income, purely based on how that $1 million is split between taxable, tax-deferred, and tax-free accounts.
Required withdrawals you don't get to skip
If part of your $1 million sits in a traditional IRA or 401(k), the IRS eventually requires you to start taking money out whether you need the income or not. Required minimum distributions, or RMDs, generally begin the year you turn 73(4). The first year typically comes with two possible deadlines, either December 31 of the year you turn 73 or April 1 of the following year, and missing the deadline carries a penalty of 25% of the amount not withdrawn, reduced to 10% if corrected within two years(4).
RMDs are calculated using an IRS life expectancy divisor. At age 73, the Uniform Lifetime Table divisor is 26.5, which works out to a required withdrawal of roughly 3.77% of the account's prior year-end balance in that first year, a rate that climbs gradually each year after as the divisor shrinks(4). Roth IRAs are exempt from RMDs during the original owner's lifetime, which is one reason some retirees weight Roth conversions into their planning before RMD age hits(4).
The practical implication: if your $1 million is mostly in tax-deferred accounts, your withdrawal rate in your mid-70s and beyond may not be entirely your choice. It's worth checking whether your planned spending rate and your required distribution rate are heading toward the same number, or diverging.
The bucket approach, and why timing matters more than the withdrawal rate itself
One alternative to a flat percentage withdrawal is the bucket strategy, which several major firms including Vanguard have written about extensively. Instead of selling a slice of the whole portfolio every year, you split the money by when you'll need it. A near-term bucket holds one to two years of expenses in cash or cash equivalents. A medium-term bucket, often covering the next several years, holds more conservative income-generating investments. A long-term bucket stays invested for growth(5).
The reasoning behind this structure isn't really about the withdrawal rate. It's about sequence. A downturn that hits in your first few years of retirement can do outsized damage, because you're selling shares at depressed prices to fund withdrawals at the exact moment your account balance is at its largest and most exposed. Vanguard research has found that a 5% reduction in withdrawal amounts during a market downturn in the first five years of retirement can be enough to eliminate the risk of running out of money early, even for retirees who happened to start withdrawing at the worst possible time historically(5). Retirees who began withdrawals right as a major bear market started faced a higher rate of portfolio depletion than those who started during a partial downturn, underscoring how much timing, not just the withdrawal percentage, drives the outcome(5).
The bucket structure doesn't eliminate that risk, but it gives you a buffer. If markets drop in year one, you're spending down the cash bucket instead of selling stocks at a loss, buying time for the growth portion of the portfolio to recover before you need to touch it.
Common mistakes worth catching before they cost you
Treating the 4% rule as fixed instead of a starting point. The rule assumes a specific portfolio mix and a rigid annual increase regardless of market performance. Real retirees adjust, and Schwab's own research shows that spending typically declines over time rather than rising steadily with inflation(1).
Forgetting that RMDs can force your hand. If your $1 million is concentrated in tax-deferred accounts, your withdrawal rate in your mid-70s may be dictated by the IRS divisor table rather than your spending plan, and that rate only grows from there(4).
Ignoring healthcare as a separate, growing line item. A 65-year-old retiring in 2026 can expect to spend an average of $185,500 on healthcare and medical costs throughout retirement under Original Medicare, a figure that rose 7.5% from the year before and doesn't include long-term care(6). That's not a rounding error against a $1 million balance. It's worth budgeting for explicitly rather than assuming it's absorbed into general spending.
Chasing dividend yield without weighing the tradeoff. With large-cap dividend yields running around 1.16% to 1.4% as of late 2025, a portfolio built to maximize dividend income often means concentrating in a narrower set of sectors, which changes your risk profile in ways that aren't always obvious upfront(7).
Key takeaways
- On $1 million, a 4% withdrawal rate produces about $40,000 in year one, but Schwab's 2026 modeling suggests a sustainable range of $37,000 to $48,000 depending on your time horizon and desired confidence level(1).
- Social Security adds an inflation-adjusted floor. The average benefit is about $24,850 a year per person as of early 2026, with a 2.8% cost-of-living increase built in for the year(2,3).
- If part of your $1 million sits in tax-deferred accounts, required minimum distributions generally start at age 73 and follow an IRS schedule you don't control(4).
- Healthcare costs are a separate, sizable expense. Fidelity's 2026 estimate puts average retiree healthcare spending at $185,500 for a 65-year-old under Original Medicare, not counting long-term care(6).
- Sequence of returns, meaning what the market does in your first few years of retirement, can matter more than your withdrawal rate. A cash buffer or bucket structure is one way to manage that risk(5).
Where to go from here
None of this replaces a plan built around your specific accounts, tax situation, and time horizon. It's a framework for the conversation. If you want to see how your own numbers stack up against these ranges, or how Social Security timing changes your first-year withdrawal need, run the numbers with a tool built for it or talk through the tradeoffs with a licensed advisor before you lock in a withdrawal rate.
If you are thinking about retirement and want to gain clarity, finding an advisor is the clearest next step, and all you need to do is answer a few questions to get started:
This article is for general informational and educational purposes only and does not constitute personalized investment, tax, or legal advice. Nothing in this article constitutes investment advice. All investors are encouraged to conduct their own research and consult a qualified financial advisor before making any investment decision. Past performance is not a guarantee of future results.
References
1. Kawashima, Chris. "The 4% Rule: How Much Can You Spend in Retirement?" Charles Schwab, March 27, 2026. https://www.schwab.com/learn/story/beyond-4-rule-how-much-can-you-spend-retirement
2. "What is the average monthly benefit for a retired worker?" Social Security Administration, January 2, 2026. https://www.ssa.gov/faqs/en/questions/KA-01903.html
3. "Social Security Announces 2.8 Percent Benefit Increase for 2026." Social Security Administration, October 24, 2025. https://www.ssa.gov/news/en/press/releases/2025-10-24.html
4. "Retirement Topics — Required Minimum Distributions (RMDs)." Internal Revenue Service. https://www.irs.gov/retirement-plans/plan-participant-employee/retirement-topics-required-minimum-distributions-rmds
5. "Safeguarding Retirement in a Bear Market." Vanguard Research, June 2020. https://www.vanguard.co.uk/content/dam/intl/europe/documents/en/whitepapers/safeguarding-retirement-bear-market.pdf
6. "Fidelity Investments Shares 25th Annual Retiree Health Care Cost Estimate." Fidelity Investments via Business Wire, July 21, 2026. https://www.businesswire.com/news/home/20260721306626/en/Fidelity-Investments-Shares-25th-Annual-Retiree-Health-Care-Cost-Estimate-Highlighting-the-Importance-of-Incorporating-Potential-Health-Expenses-in-Retirement-Planning
7. "S&P Dow Jones Indices Reports U.S. Common Indicated Dividend Payments Increase of $13.1 Billion in Q4 2025 and $46.4 Billion for 2025." S&P Dow Jones Indices, January 7, 2026. https://press.spglobal.com/2026-01-07-S-P-Dow-Jones-Indices-Reports-U-S-Common-Indicated-Dividend-Payments-Increase-of-13-1-Billion-in-Q4-2025-and-46-4-Billion-for-2025
8. "Income Annuity Estimator." Charles Schwab. https://www.schwab.com/annuities/fixed-income-annuity-calculator
9. "Life Expectancy Calculator." Social Security Administration, Office of the Chief Actuary. https://www.ssa.gov/OACT/population/longevity.html