
Key takeaways
- In federal spending data, households headed by someone 75 or older spent an average of $55,834 in 2024, about 15% less than households headed by someone 65 to 74 and about 34% less than those headed by someone 55 to 64.
- Transportation and dining out shrink the most with age, while health care grows.
- A 2026 study found that even retirees who are relatively well off tend to cut inflation-adjusted spending over time, which suggests the slowdown is often a choice rather than a squeeze.
- The late years carry costs a flat budget can miss, including long-term care that Medicare doesn't pay for and that almost 70% of people turning 65 will need in some form.
- A phased plan can lower the amount you need to save, as long as part of the savings is set aside for care late in life instead of being spent twice.
Picture the retirement you've been saving for, and you'll probably see it in its first few years. There's the trip you put off while the kids were in school, the long weekends with grandchildren, maybe a second car or a kitchen you finally renovate. Now picture yourself at 85. The calendar likely looks different, with fewer flights and more doctor's appointments, and your spending has probably changed along with it.
Many retirement plans skip over how different those pictures and timelines look. They take one annual spending figure, raise it with inflation every year, and assume you'll need that same amount at 92 that you needed at 66. That approach is easy to calculate, but for many households it overstates what the later years cost in some categories and understates them in others.
This article investigates how spending tends to change across the decades of retirement, what the research says about why, where costs climb late in life, and how a phased spending plan can change the amount you need to have saved.
Why do so many retirement plans assume spending stays the same?
A flat spending assumption is the starting point for much of the retirement research you'll read about. Morningstar, an independent investment research firm best known for its fund ratings and retirement income studies, publishes an annual estimate of how much a new retiree can safely withdraw in their first year of retirement. Its 2026 figure is 3.9%, which it describes as the highest safe starting withdrawal rate for retirees seeking a consistent level of inflation-adjusted spending, with a 90% probability of money remaining after 30 years(1). On a hypothetical $1 million portfolio, that's $39,000 in the first year, raised for inflation each year after.
That kind of plan treats your 30th year of retirement exactly like your first.
It's a reasonable place to start, because it guards against the worst case, but it builds in an assumption that your lifestyle at 90 will cost as much, in today's dollars, as your lifestyle at 65. Morningstar's own research points out that older retirees can reasonably spend well more than the 3.9% base case, because that figure assumes a 30-year horizon(1).
The question underneath all of this is how spending changes once you stop working. If it drifts down as you age, a flat plan asks you to save more than you need, or to spend less in your 60s than you could. If it climbs late in life because of health and care costs, a plan that assumes a steady decline could leave you short when you can least afford it. The data suggests both things happen, in different parts of the budget.
How does spending change from one decade to the next?
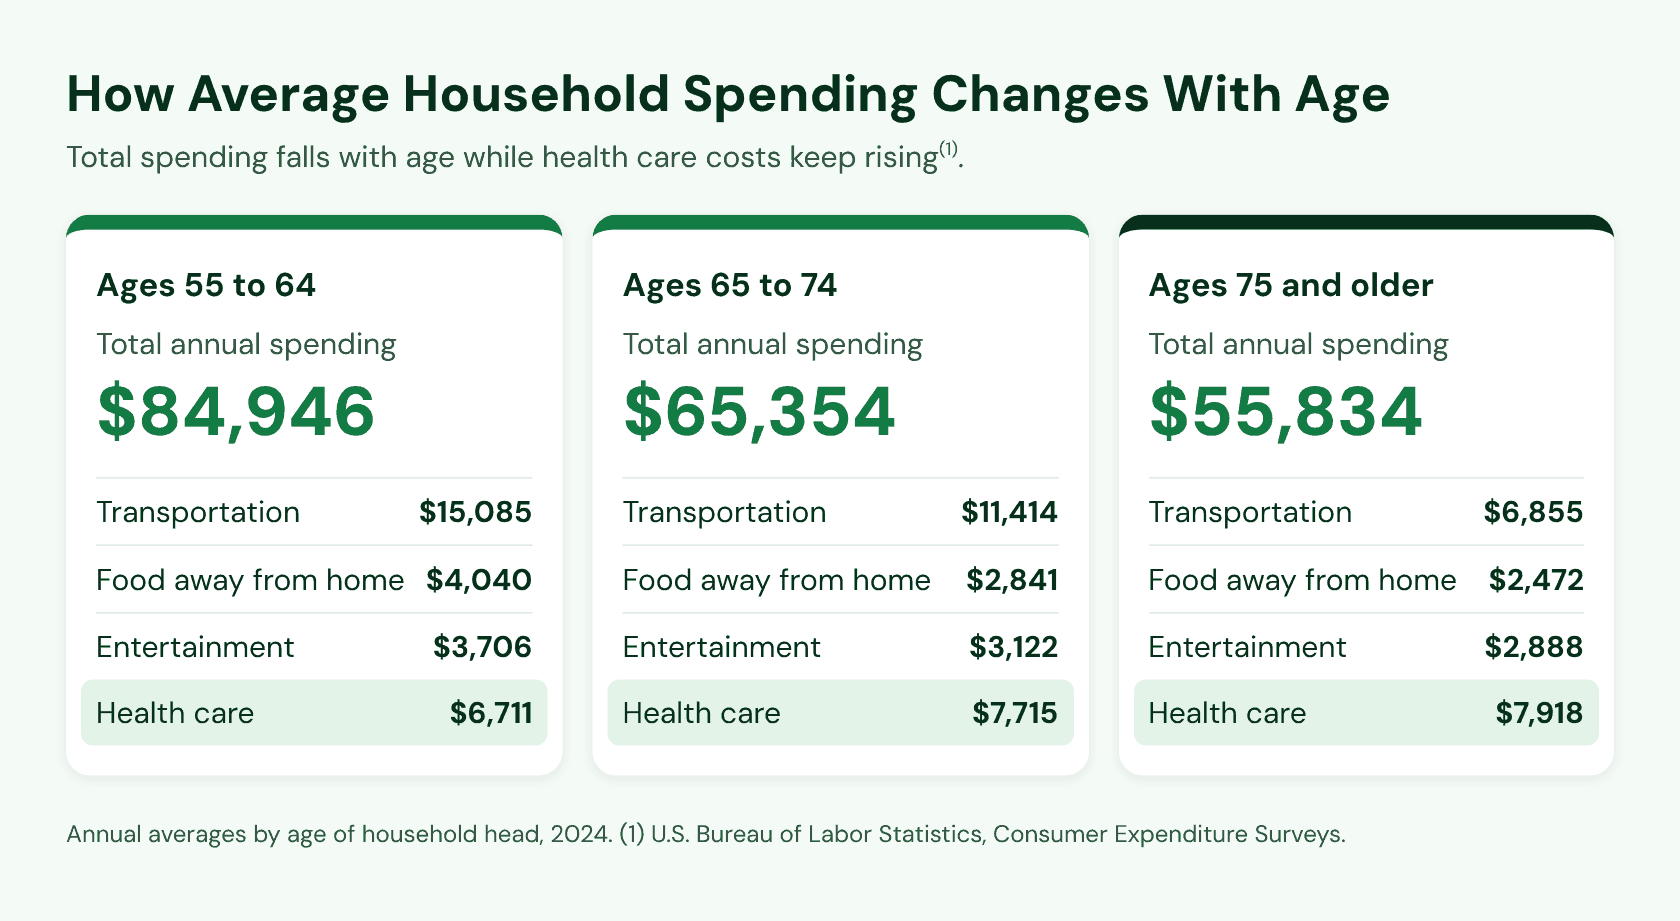
The U.S. Bureau of Labor Statistics (BLS) runs the Consumer Expenditure Surveys, which track what American households spend each year, broken out by the age of the person who heads the household. The 2024 figures show a steady step down in total spending with age. Households headed by someone 55 to 64 spent an average of $84,946, households headed by someone 65 to 74 spent $65,354, and households headed by someone 75 or older spent $55,834(2).
That's a drop of about 23% between the late working years and the first decade of retirement, and another 15% between the first decade and the years after 75. The second drop deserves a closer look in a retirement plan, because it happens well after the transition from work is over.
The table below compares several of the largest categories across the three age groups.
Transportation falls the furthest.
Households headed by someone 75 or older spent $6,855 on it, less than half the $15,085 spent by households headed by someone 55 to 64. Dining out and entertainment follow the same direction at a gentler pace(2).
Housing follows a different path.
It drops about 17% between the late working years and the first decade of retirement, then barely moves, from $22,329 for households headed by someone 65 to 74 to $21,999 for those headed by someone 75 or older(2). As a result, housing takes up a larger share of a smaller budget, about 39% of spending for households headed by someone 75 or older compared with about 32% for those headed by someone 55 to 64.
Health care is the only category in the table that rises.
Households headed by someone 75 or older spent $7,918 on it, about 18% more than the $6,711 spent by households headed by someone 55 to 64. As a share of total spending, health care grows from about 8% to about 14%(2).
What these averages can and can't tell you
These figures compare different households at a single point in time, not the same households as they age. Today's 80-year-olds grew up, worked, and saved under different conditions than today's 60-year-olds, so part of the difference reflects who they are rather than what aging does to a budget. The pattern is helpful in understanding your own plan, not a forecast of it.
Is the slowdown a choice or a squeeze?
If older households spend less only because they've run short of money, building a decline into your plan would be a mistake, since it would bake in a squeeze you'd rather avoid. Research that follows the same people over time helps answer that question.
A 2026 study published in Financial Planning Review used data from the Health and Retirement Study, a long-running University of Michigan survey that follows the same older Americans over many years. The study found that inflation-adjusted retiree spending tends to decrease over time and that even retirees who are relatively well off typically reduce their real spending, which the authors read as a sign that choice is a key driver in the decision to spend less. The study also found that the evidence supports more than one spending pattern over a full retirement, depending on the modeling assumptions, and concluded that reduced real spending needs to be better integrated into retirement planning models(3).
In everyday terms, many retirees spend less as they age by choice, not only because they've run short of money.
That's an encouraging finding if you're worried about outliving your savings. It doesn't promise that your own spending will fall, but it does suggest that a flat, inflation-adjusted budget isn't the only defensible assumption.
Where costs climb late in retirement.
Planning for a lower budget in your 80s works only if you also plan for the costs that don't follow the same curve and climb as you get older.
How much will health care cost over a full retirement?
Fidelity Investments, one of the largest U.S. retirement plan providers, publishes an annual estimate of lifetime health care costs for a new retiree. Its 2026 estimate is that a 65-year-old retiring this year can expect to spend an average of $185,500 on health care and medical expenses throughout retirement, up 7.5% from the year before. The estimate assumes enrollment in Original Medicare (Parts A and B) and Medicare Part D, includes premiums, copayments, and other out-of-pocket costs, and assumes no employer retiree health coverage(4).
Just as important is what it leaves out. Fidelity's estimate does not include long-term care, most dental services, or over-the-counter medications(4). Those costs are added on top of the $185,500.
What about long-term care?
Long-term care covers medical and non-medical care for people who have a chronic illness or disability, whether it's delivered at home, in the community, or in a nursing home. Someone turning 65 today has almost a 70% chance of needing some type of long-term care services and support in their remaining years. Women need care longer on average, 3.7 years compared with 2.2 years for men, and 20% of today's 65-year-olds will need care for longer than five years, while about one-third may never need it at all(5, 6).
Many people assume Medicare will handle this, but it generally won't. Because most long-term care is non-medical, Medicare and most health insurance, including Medicare Supplement Insurance (Medigap), don't pay for long-term care services, including care in a nursing home or in the community(6). That leaves savings, long-term care insurance, family help, or Medicaid after assets run low.
This is the reason a declining spending curve needs a floor under it.
How long should your spending plan run?
A spending plan only works if it covers enough years. The Social Security Administration's (SSA) period life table, used in the 2026 Social Security Trustees Report, gives a 65-year-old man an average of 18.12 more years and a 65-year-old woman an average of 20.66 more years, which puts the averages at about age 83 and age 86(7).
An average is the midpoint, though, which means many people live well past it. Based on the same SSA table, about 24% of 65-year-old men and about 35% of 65-year-old women would reach 90, and roughly 8% of men and 14% of women would reach 95(7). For a married couple, the odds that at least one spouse reaches 90 are higher still. Planning to an average leaves a large share of households with added years of life their plan didn't cover.
What does a phased spending plan do to your savings target?
Here's a hypothetical example to show how the shape of spending changes the amount your portfolio has to cover. Consider a retiree at 65 who expects to spend $80,000 a year and receives $40,000 a year from Social Security, so savings need to cover the other $40,000. To keep the comparison simple, every figure is in today's dollars, Social Security is assumed to keep pace with inflation, and investment growth is left out.
Under a flat plan, the portfolio covers $40,000 every year for 30 years, or $1.2 million in total withdrawals. Using Morningstar's 3.9% starting rate(1), supporting a $40,000 first-year withdrawal would take a portfolio of about $1,025,600.
Under a phased plan, spending holds at $80,000 from 65 through 74, then drops about 15% to $68,000 from 75 onward, which mirrors the difference between average spending for households headed by someone 65 to 74 and those 75 or older in the BLS data(2). The portfolio covers $40,000 a year for the first decade and $28,000 a year for the next two.
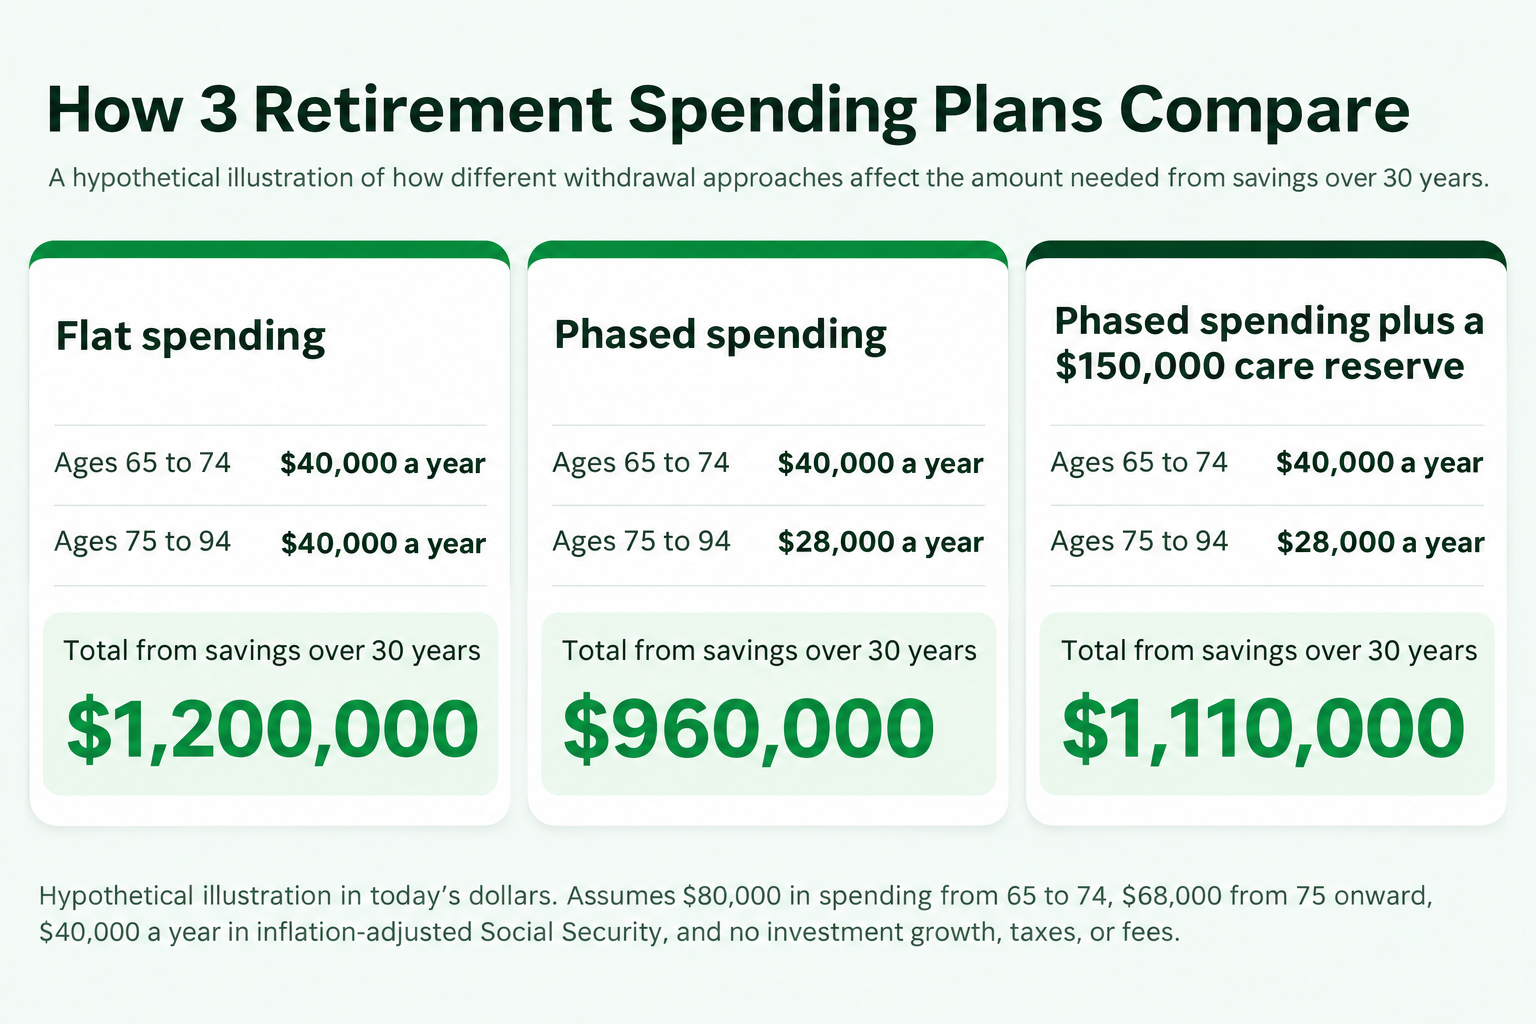
The phased plan asks the portfolio for $240,000 less over 30 years, a 20% reduction in total withdrawals. That's a substantial difference, and for someone still working, it could mean a smaller savings target or more room to spend in the first decade.
The third row is the more cautious version. Setting aside a hypothetical $150,000 for late-life care brings the total back to $1.11 million, which is still $90,000 below the flat plan but no longer treats the lower spending in your 80s as pure savings. The right size for that reserve depends on care costs where you live, whether you have long-term care insurance, and whether you'd expect to receive care at home or in a facility.
How do you sketch your own spending curve?
National averages can show the general shape, but your plan has to rest on your own budget. A few steps can turn the idea of phased spending into numbers you can use.
- Split your current budget into essentials such as housing, food at home, insurance, utilities, health care and discretionary spending such as travel, dining out, hobbies, gifts.
- Decide which discretionary items belong to your early retirement years and estimate when you'd expect them to taper off.
- The BLS data shows housing costs change little after 65, so hold housing roughly steady unless you plan to downsize or pay off a mortgage.
- Let health care grow over time rather than holding it flat, and add a separate reserve or insurance plan for long-term care.
- Run the plan to at least age 90, and to 95 if you're in good health or have a family history of long lives.
Revisit the curve every few years, because a plan you sketch at 63 will likely need adjusting as your health, family, and interests change, and an annual look at what you spent can show whether your slowdown is arriving earlier, later, or not at all.
Does a declining spending curve change your withdrawal rate?
A lower budget later in retirement means your portfolio carries less weight in those years, which can support a higher withdrawal in the early ones. Morningstar's research found that retirees willing to tolerate some fluctuation in their spending can start with a withdrawal rate of nearly 6%, compared with 3.9% for a fixed inflation-adjusted plan, and that each flexible spending method it tested supported a higher starting rate than the fixed approach(1).
The 2026 Financial Planning Review study makes a related point from the spending side, concluding that reduced real spending needs to be better integrated into retirement planning models(3).
A higher early withdrawal rate isn't free money, though.
It works only if you're prepared to spend less later, and only if the care reserve and the essential bills stay protected when you do.
Common mistakes when planning for changing spending
Treating the slowdown as guaranteed
The BLS figures and the 2026 study describe tendencies across large groups, not a promise about any one household. A retiree who plans to cut spending sharply at 75 and then finds that a spouse's health, a grandchild's tuition, or a home repair keeps costs high could be withdrawing from a portfolio that was sized for a smaller budget. Build in a decline you'd be comfortable with even if it arrives later than planned.
Spending the same savings twice
A phased plan lowers what you'll likely spend on travel and cars in your 80s, and it's tempting to spend that difference in your 60s. The trouble is that almost 70% of people turning 65 will need some type of long-term care in their remaining years, and Medicare doesn't pay for it(5, 6). If the early-retirement budget absorbs every dollar the spending slowdown frees up, there's nothing left for care when it's needed. Decide how much of the difference goes to the early years and how much goes to a reserve.
Planning to the average age
Average life expectancy at 65 lands in the low-to-mid 80s, but about one in three women and nearly one in four men who reach 65 would live to 90 under the SSA's current life table(7). A plan that runs out at 85 fails for a large share of the people who use it.
Where to go from here
A spending curve is personal, and it's easier to draw with someone who can test it against your accounts, your Social Security timing, and a realistic care reserve. A fee-only fiduciary advisor can compare a flat plan and a phased one side by side, so you can see how much each asks of your savings before you settle on a retirement date or a first-year withdrawal.
Nothing on this site constitutes investment advice. All investors are encouraged to conduct their own research before making any investment decision. Past performance is not a guarantee of future results.
Greensprout is an independent, advertising-supported publisher and comparison resource. We may earn compensation when you click on links to products from our partners. This does not affect our editorial standards or recommendations.
All dollar figures in the phased spending example are hypothetical illustrations based on the assumptions stated with the example. They are not projections of any investment's performance.
References
1. Morningstar. "What's a Safe Retirement Withdrawal Rate for 2026?" https://www.morningstar.com/retirement/whats-safe-retirement-withdrawal-rate-2026
2. U.S. Bureau of Labor Statistics. Consumer Expenditure Surveys, 2024, Expenditures by Age of Reference Person, as published by the Federal Reserve Bank of St. Louis (FRED). https://fred.stlouisfed.org/release/tables?rid=479&eid=1198191
3. Blanchett, David. "How Spending Evolves in Retirement: A Smile, a Smirk, or Something Else?" Financial Planning Review, Vol. 9, Issue 2, e70032 (2026). https://doi.org/10.1002/cfp2.70032
4. Fidelity Investments. "Fidelity Investments Shares 25th Annual Retiree Health Care Cost Estimate." July 21, 2026. https://newsroom.fidelity.com/pressreleases/fidelity-investments--shares-25th-annual-retiree-health-care-cost-estimate--highlighting-the-importa/s/0dd560b4-98cb-492e-bdec-f7168f97aede
5. Administration for Community Living, LongTermCare.gov. "How Much Care Will You Need?" Last modified February 18, 2020. https://acl.gov/ltc/basic-needs/how-much-care-will-you-need
6. Medicare.gov. "Long-term care." https://www.medicare.gov/coverage/long-term-care
7. Social Security Administration, Office of the Chief Actuary. "Actuarial Life Table" (Period Life Table, 2023, as used in the 2026 Trustees Report). https://www.ssa.gov/oact/STATS/table4c6.html